A Log amplitude sweep is similar to a stepped sine sweep except a single frequency is selected and swept logarithmically across a range of levels. It may sweep from a low level to high, or a high level to low. This test signal is used for testing linearity, to see how devices perform when different stimulus levels are presented and for testing devices with automatic gain control (AGC). For example, to see at what level a compressor kicks in and how it behaves at different input levels. Amplitude sweeps are also used to test the linearity of devices such as hearing aids and can also be used in conjunction with advanced analysis algorithms to look at characteristics like THD vs. stimulus level, which will produce a curve that has % distortion on the y-axis and stimulus level on the x-axis.
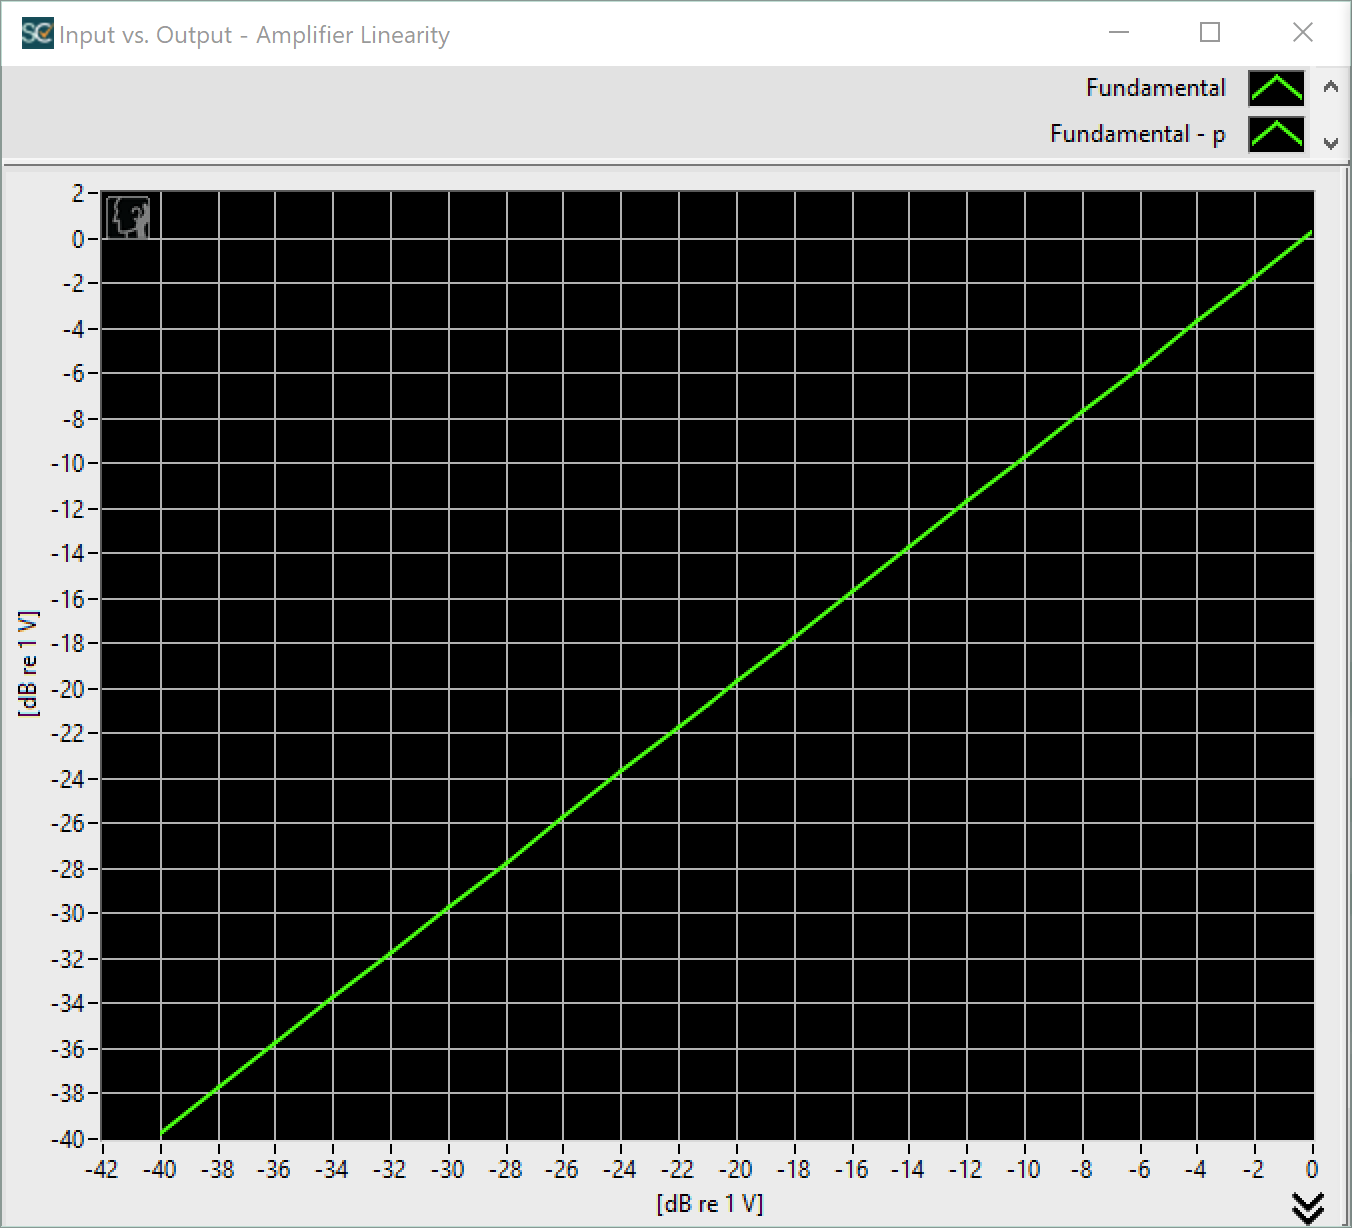
In this example, we will measure the linearity of an audio amplifier and plot its input vs. output level on an x-y graph.
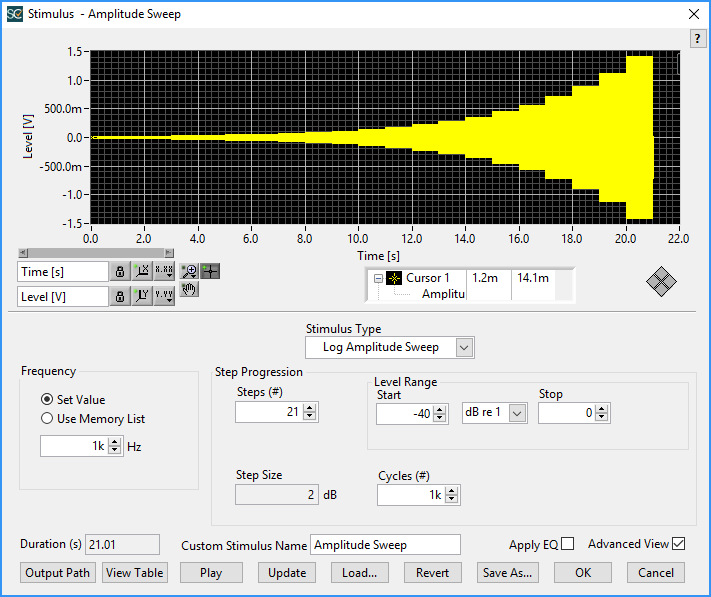
The stimulus parameters are:
- Stimulus type: Log Amplitude Sweep
- Frequency: 1 kHz
- Start Level: 10 mV (-40 dBV)
- Stop Level: 1 V (0 dBV)
- Number of steps: 21
- Cycles per step: 1000
- Step size: 2 dB
This is how the Stimulus Editor is configured:
After the Play and Record acquisition step captures the recorded time waveform of the DUT, the stimulus and response waveforms are run through a HarmonicTrak analysis step to derive the fundamental response.
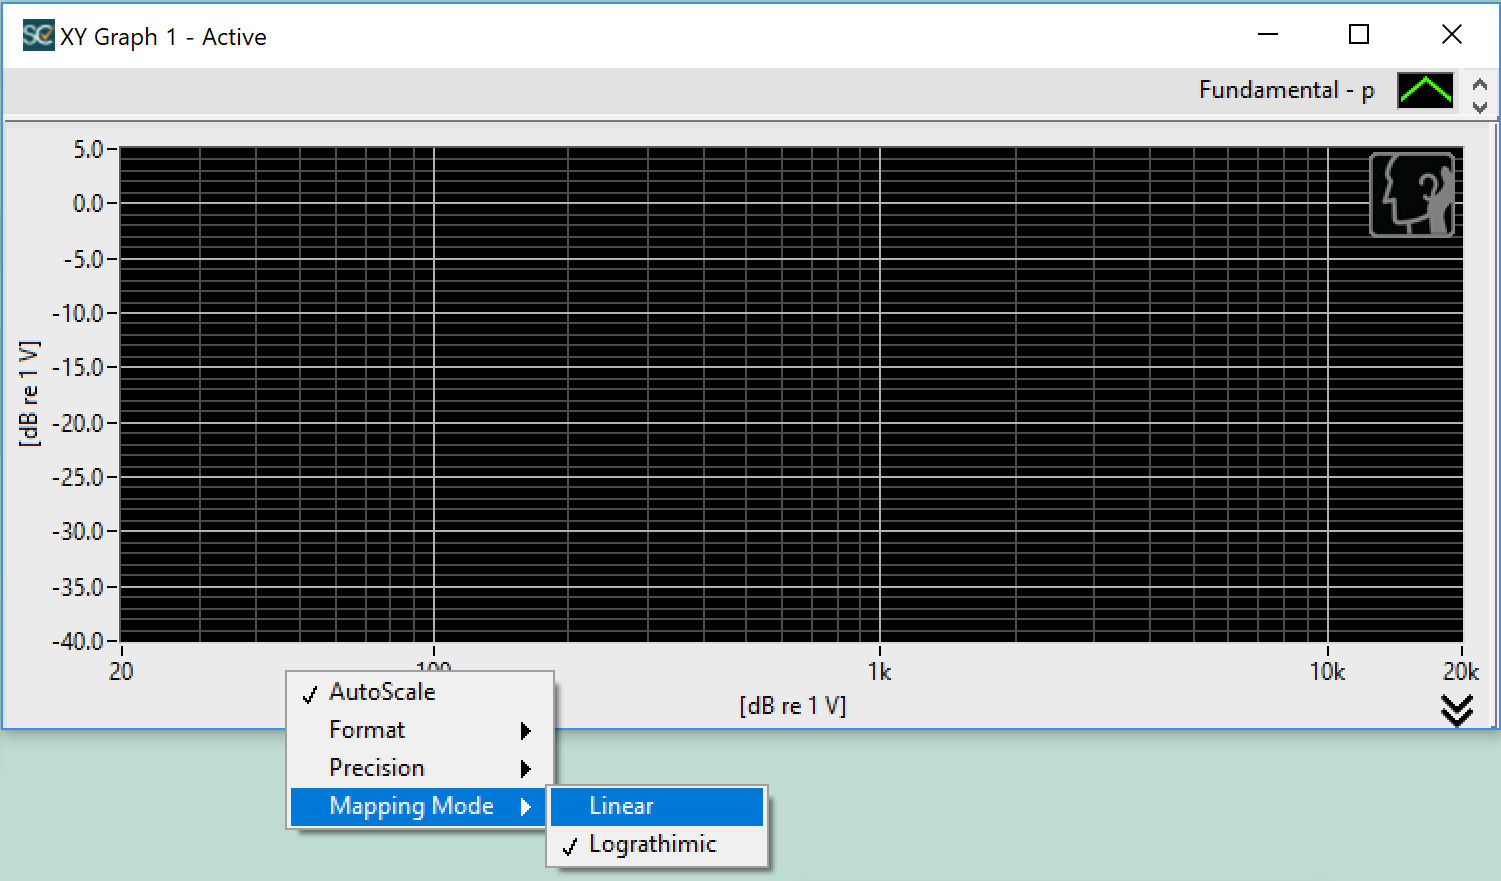
The question is, how to configure the x-y graph to properly display the response curve? If the amplitude sweep response curve was simply displayed on a default SoundCheck x-y graph, the graph would appear to be empty. Why? Because of the graph's default x-axis logarithmic scaling. Since the x-axis range of the curve is -40 dBV to 0 dBV and negative values can't be displayed on a log scaled axis, the graph appears to be empty.
The answer is to change the x-axis scaling to linear. This can be done in a couple of different ways. The most direct method is to right-click directly on the x-axis, and select Mapping Mode > Linear:
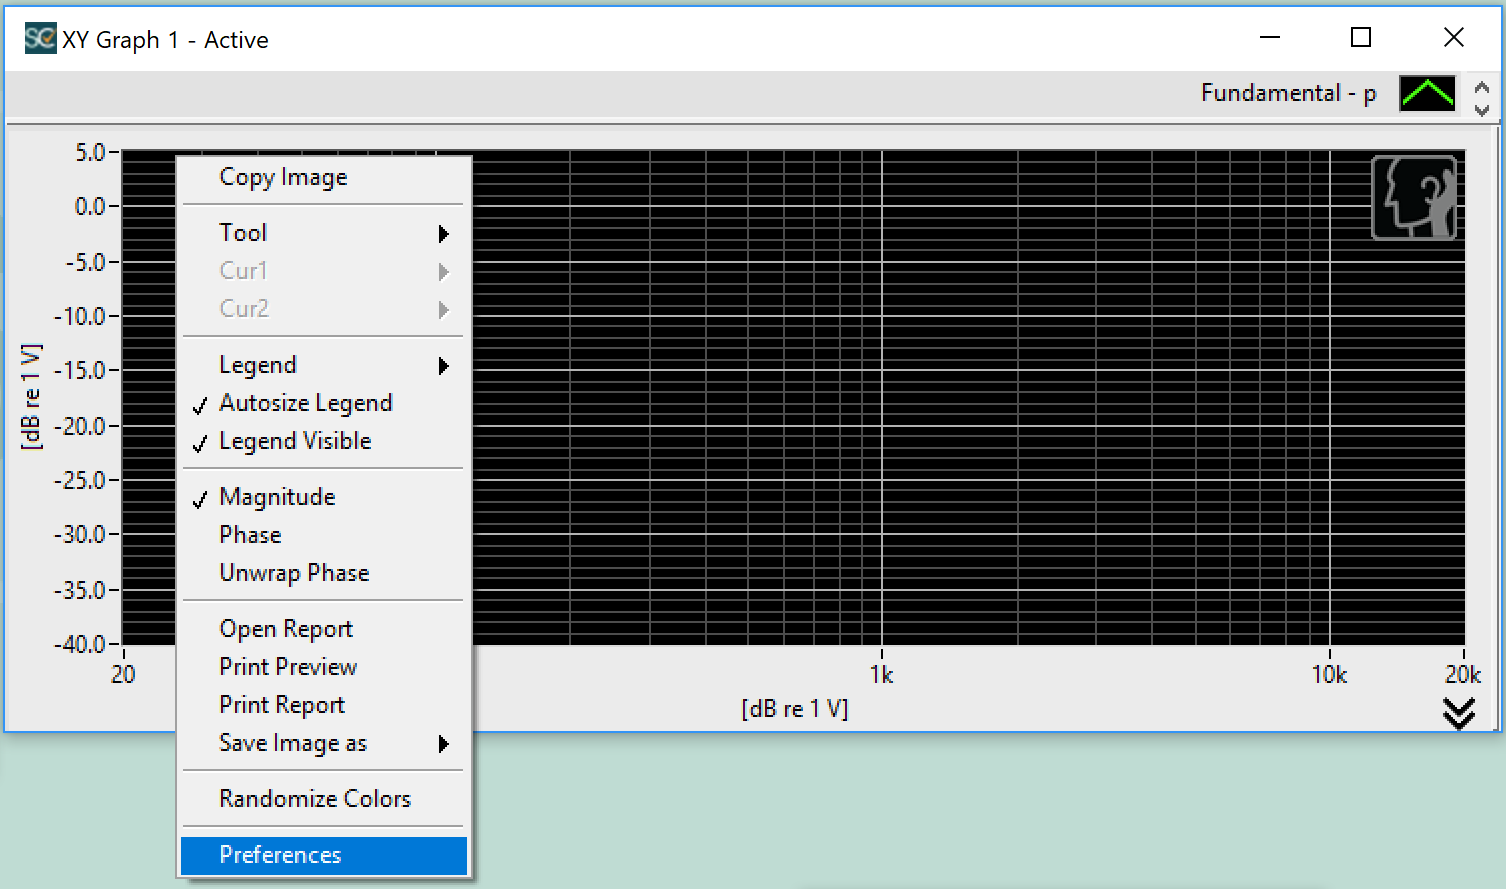
Alternately, you can right click on the plot area and select Preferences:
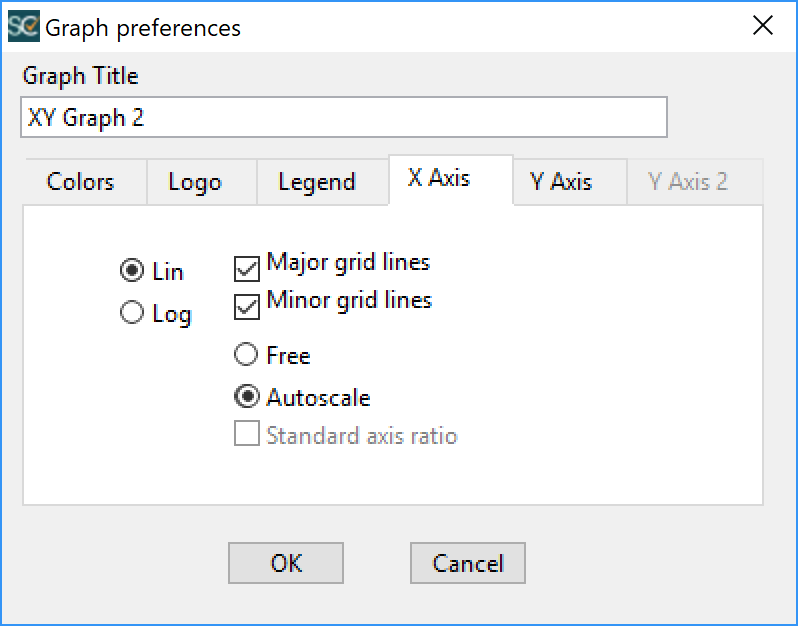
This opens the Graph Preferences dialog. Click on the X Axis tab, change the scaling to Linear and click OK.
Using either method, your x-y graph is now properly configured to display an amplitude sweep.
To simplify this task, an Amplitude Sweep Display Step Template is included in SoundCheck 16.
SoundCheck 16 Example sequence link below.
Comments